Why Oivalo
Tailored Planning
Driver based Planning - Create plans based on your own KPIs and business logic
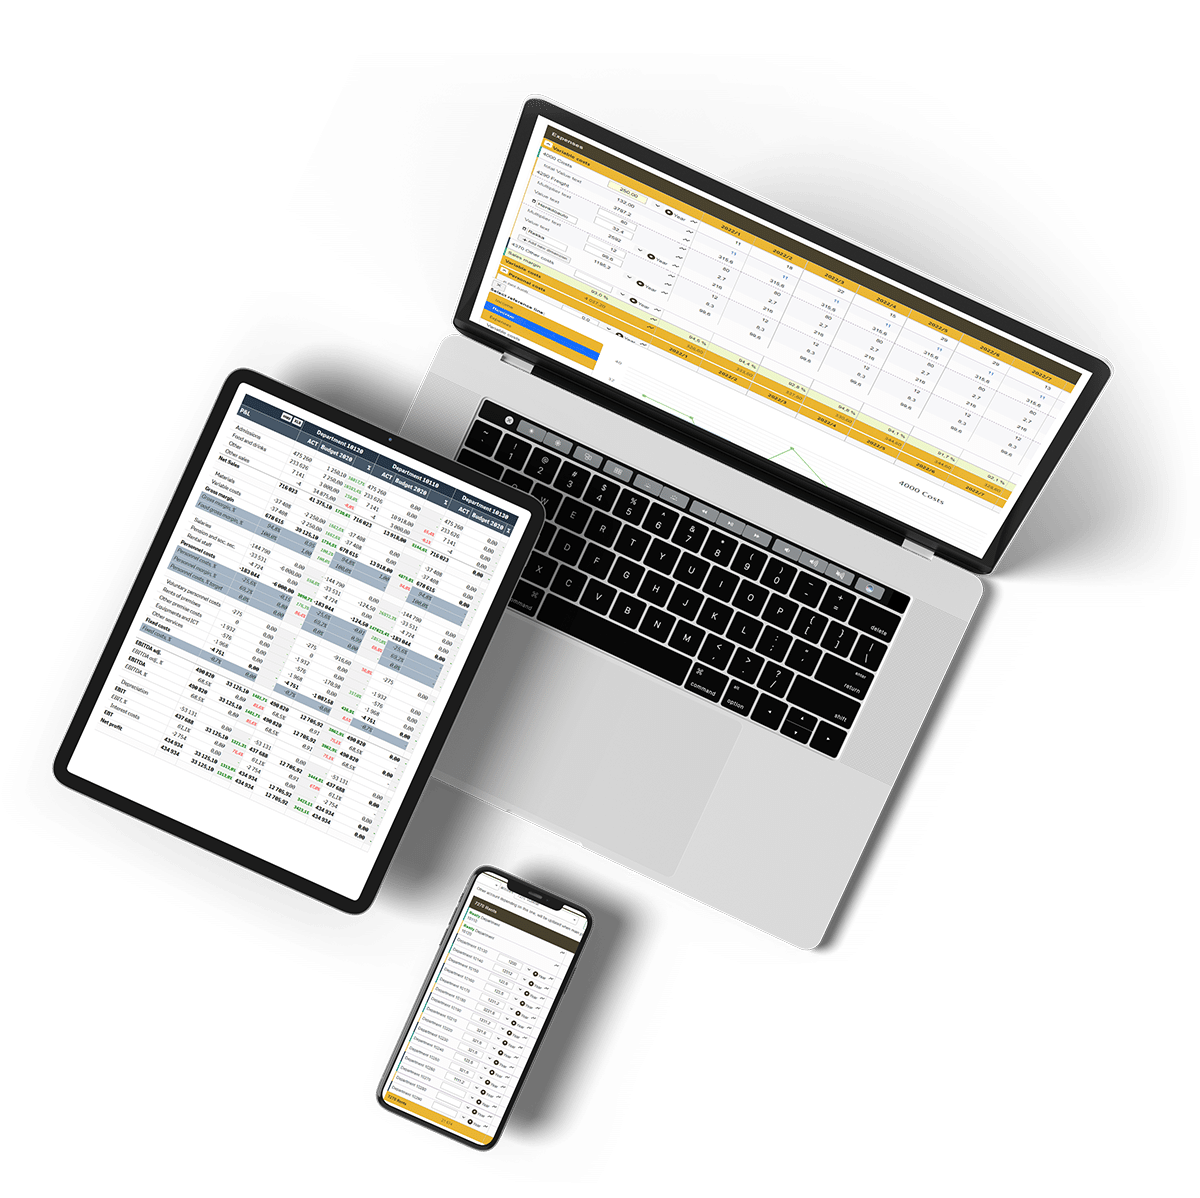
Combine business targets and P&L forecasts directly within same driver based planning models
Rapid setup
Implementation project should take days not weeks and with Oivalo Planning it is more a business than an IT project.
Simple follow up and control
Follow and steer planning process, approve plans, summarize multiple units or review planned data on your own reporting structure.
Compare plans to actuals, other planning period, last year - in realtime.
Oivalo Planning is for you IF
The current budgeting process is heavy
You have a budgeting model currently in Excel but it is not flexible to handle different budgeting versions, update actuals, compare forecasts, and consolidate numbers from multiple files.
You want to easily create and handle multiple forecast rounds and versions or have "running forecasting" process.
You want to easily move from full year's budget to ACT+BUD forecast and have it as an alternative version.
You want to use multiple currencies and translate your planning model to different languages
You have a lot of users participating and don't want to spend time with multiple spreadsheets
You want to improve your business planning and analytics
You want to collect and consolidate drivers and planning details from multiple units quickly and easily.
You want to use complex planning drivers
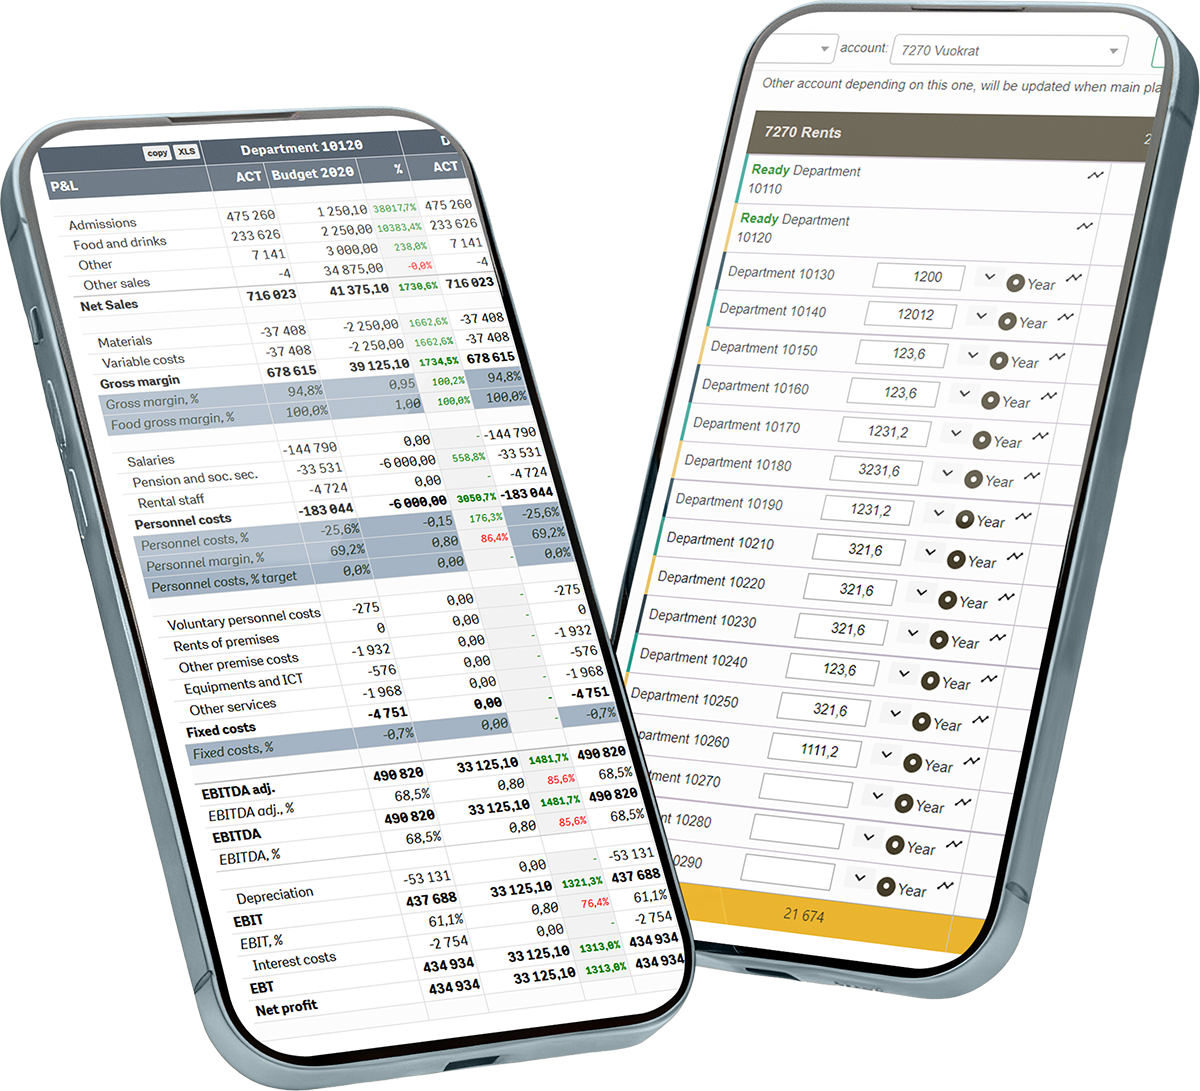
You need to create Profit and Loss budgeting and more detailed operative planning – Oivalo Planning will combine sales drivers with Profit and Loss in one model.
You want to have budgeting and forecasting numbers as references besides actuals in your reporting system.
You want to do day level planning
You want to get started quickly
You are looking for an enterprise-level tool for planning which has the flexibility you need in your budgeting process.
You don't want to spend high starting cost or several months to just try out a planning tool
In the most optimal case you already have the reference data ready in SQL, DW or in reporting system and some idea how the planning model should be
Select a customer and read how they are using the Oivalo Planning
Case SYNLAB
SYNLAB is Finland's largest private producer for laboratory examinations and imaging services. SYNLAB takes care of the well-being of Finns by offering advanced, innovative and effective services for regular health monitoring and disease prevention. It produces services for the public and private sector, private healthcare providers, insurance companies, health insurance funds and private customers. The head office and main laboratory are located in Helsinki. SYNLAB uses around 160 cost centers in budgeting.
SYNLAB started using OIVALO's budgeting system during spring 2021. The main reason for the change was to modernize the budget process, that was previously based on a large number of different Excel files. The Excel-based budgeting was considered vulnerable and the management took a lot of time, especially from the responsible persons of group's finance.
Due the differences in Excel sheets, summing up the numbers at the group level was almost entirely done manually. It went so far, that the numbers for the budget had to be recorded to Excel at a higher level, to reduce the time spent on manual combining work.
The project to transfer to SYNLAB budgeting process into Oivalo platform was very fast. The initial planning was done in a two-hours meeting, and after about a week, everyone in SYNLAB Finland had the opportunity to record their budgeting figures by using OIVALO's cloud-based budgeting system.
There was hardly any resistance to change. Quite the contrary, the new service was especially liked by the most skilled Excel users. In addition, the end users were relieved by the fact that in the new model they could modify the Excel the most suitable time for them -without need to wait while other users had the excels locked for their modifications.
At the finance department, the implementation of OIVALO allowed more time to be used for the most important financial and reporting work. There is now a possibility to use much more time to build relevant Power BI reports, and the controllers focus their time on analyzing the numbers. Managing the process is "100 times easier" and enables the budgeting to be a lot faster and forecasting a lot effortless compared when working with Excels.
In SYNLAB, OIVALO's budgeting platform is tightly integrated with Power BI. During the beginning of budgeting and forecasting period, the actuals from previous year are brought from Power BI to OIVALO. And other way around, budgets by cost centers are shown in Power BI next to actuals. As all the numbers are originated from cloud base platform, it’s possible to include both budgeted and actual figures into all reports at the level of different cost centers as well as whole group.
- More time spent on financial analyses than Excel validation
- Reducing human errors during budgeting
- Speeding up the budgeting process
- Comparison of actuals to budgeted without added manual work
Case NoHo Partners Plc
NoHo Partners Plc is a Finnish restaurant group behind more than 250 restaurants, bars, pubs, nightclubs and entertainment centres in Finland, Norway, Denmark and Switzerland.
Oivalo Planning allows NoHo to take control of nearly 300 cost centers requiring Profit&Loss budgeting and forecasting in four currencies. Previous model was Excel based and was time consuming to fill, version handling and consolidation was practically impossible.
- Group consolidation of planned numbers with easy steer and control of the process
- Capability to handle great amount of users from single restaurant manager to a group and division level executives
- Delivery of reference numbers to the end user in an environment which requires strict data access restrictions (PLC)
- Easy data integration from and to internal masterdata (like Cost center structure, actuals) and BI system
- Running forecast enabler with versioning
- Handle planning in different currencies
- Combined with Oivalo Account Manager – a SaaS software for PL report control – it is possible for the users to see the planned values with reference actuals on familiar P&L report models
Case HopLop
HopLop is children’s indoor exercise and adventure park chain in Finland and Germany with 17 parks in total.
HopLop needed a planning tool for daily sales and Profit and Loss budgeting. The requirement was to combine planning from daily sales to monthly revenue with same input numbers - one input to one sales and to one revenue. One driver, usually the amount of children, gives the best understanding about business, rather than separate sales and revenue budget.
- Easy versioning of budgets and forecasts
- Complex, but understandable drivers.
- Amount of children per day * Ticket price * Days when park is open = Entrance sales.
- Amount of employees * Average salary = Salary expenses
- etc...
- Aligned with sales and bookkeeping data
- Data integration back to internal BI system (Qlik) with Oivalo PL extension
Case Nevel Oy
Nevel operates more than 130 energy production sites and manages over 40 district heating networks in Finland, Sweden and Estonia
The company was recently separated from Vapo Group and carveout of systems and processes had to be done. To take control of financial planning, Nevel chose Oivalo at the end of Q3 2021 due to proven concept of fast deployment and advanced features required to align with Nevel’s business model and planning logic. The project was finalized in time and 2022 budgeting was completed for over 200 cost centers with Oivalo Planning just in few weeks after the project kick-off.
Nevel controller summarizes that: “Driver based modeling was our key requirement to enable planning on site level. Megawatt hours, fuel amounts and other input are converted to full profit and loss plan for each site in Oivalo. Support for multiple currencies and possibility to quickly create new forecasts based on previous planning values and current actuals was also very important and we have found that it is easily done in Oivalo.”
Case Mehiläinen Oy
Mehiläinen Group is a well-known and highly valued private provider of social and healthcare services, offering comprehensive high-quality services in Finland and internationally providing service at 820 locations
Mehiläinen is not a typical customer for Oivalo. They have succesfully utilized Oivalo's Table Manager to control data conversions within company acquisitions requiring data integrations. History and current data must be transfered to Mehiläinen's system when another company is merged. Table Manager software has provided an easy interface in limited manner for each expertiese area to modify their own data.
Planning Main features
Multi costcenter collect data from all costcenters/departments/units etc from many users. Supports easily thousands of cost centers
Multi currency and multi language - Support for organizations having companies in different countries. UI is in Finnish and English and can be translated if needed
Multi round - Manage multiple planning rounds or versions
Flexible planning model Combine sales drivers and P&L into same model, do it easyway or advanced way. Oivalo Planning supports various driver based planning schemes and P&L structures.
Versions Use previous forecast or actuals as base data for new planning round. Create forecast with actual and existing budget, like 3 months actuals, 9 months forecast
Reference values Use history actual or other planning round values as reference numbers.
User hierarchy for approval flow, versatile commenting. Manage user access rights and hierarchies to show data with correct user easily. No risk for Excel leaking company actuals.
Microsoft Azure AD (Office 365) support Existing users from Azure can be used with Single Sign on.
Easy data integration Outcome of Oivalo Planning is easily integrated into any BI tool (Qlik, Power BI, etc) or DW that reads data from REST API.
SaaS Oivalo Planning is SaaS and mainly requires business competence to setup. Not an traditional IT project at all.
Several planning input methods:
Absolute value | P&L accounts, amount of customers, business days |
Driver based | Multiply amount of customers with avarage spend, Plan salaries using hours and hourly salary, Use reference value like number of weekend days in a month multiplied with another value |
Percentage planning models | Personel side costs with pre defined percentage, product category sales margin as a percent from planned sales, set a cost based on sales etc |
Summary and info rows | can be used in the planning model to give user information how for example Gross Margin % will set, how many weekend days are in planning round. |
Monthly or annual input | Plan on annual level and distribute values to monhts using pre-defined multipliers, previous year actuals, previous input or evenly. Or change individual month manually. |
One account - multiple costcenters input | Set numbers to one account over multiple costcenters at once. |
Graphical input | See numbers in graphs and edit values from graph with reference line. |
Dimensional planning | Split one account into several named or unnamed entries like persons, customers etc |
Simple integration for the planned data wit BI tools through Rest API. Very easy to integrate with Qlik On-premises, Qlik Cloud, Power BI and other
SaaS - no other IT costs
For controller and admin use: Export planned values to CSV/excel for further analysis, read planned data easily to existing BI system. Import planning values, copy planning round data to another round, update actuals, use actuals or other planning round for reference numbers, monitor planning progress. Manage defaults, translations, users, access rights...
Oivalo Data Management - Spreadsheet replacements
Effortless Master Data Management in the Cloud with Seamless BI Integration
Standardized approach to managing Profit & Loss and Balance Sheet visualizations, with a straightforward "no consultant" model for reporting modifications. Ideal for reporting financial data across multiple account combinations to various stakeholders, our solution simplifies the process without the need for summary accounts or complex data models.
Detailed Insights: Enable row-level drilldowns fron summary rows without relying on Data Warehouse (DW) calculations.
Qlik Sense: Visualize data and export to Excel or clipboard with ease.
Generic master data platform to replace spreadsheets which are not always so easy to use with BI. Up-to-date data from source system's dimension are available in the system for the user to set the required new meta data. For example adding new organization level on top of costcenters will not just give users controlled manner to update required information but also shows the new items from source system needing the organization definitions. When just using the spreadsheets this process requires first analysis of missing costcenters, adding them to the spreadsheet and updating the spreadsheet for BI system
Easy Integration: Read metadata from to BI so that no datawarehouse or other temporary storage is not needed.
Data Management Components
Use all together or separately with your current system
Table Manager
Replace spreadsheets on network drive with cloud based solution where latest data is waiting for classification.
Keep master data in order all the time
Integration with ease for BI or DW system
Always sturtured data input, no typos or other user related errors, user access rights, Azure Single Sign On
Account Manager
Control account mappings and Profit and Loss or Balance Sheet formulas between accounting systems and different hierarchies.
Access and provide data through API
Can be used with Oivalo Planning to show planned figures with reporting structures used elsewhere
Tested with Qlik and Power BI
Qlik Sense P&L Extension
For Qlik Visual P&L lookalike reporting in Qlik Sense optimizing Qlik features.
Other services
Oivalo Oy is a Qlik Partner.
Qlik Extensions - SimpleFieldSelect
An open source extension for all your selection needs using the Qlik Sense SimpleFieldSelect. Download it from Qlik branch or GitHub
In case of need for experienced CFO, Business Controller...
Weather Data Hub
Use actual and forecasted weather data from observation stations. Then, seamlessly link weather data to your business in a BI tool.